> ## Documentation Index
> Fetch the complete documentation index at: https://densify-sync-changelog-2.mintlify.site/llms.txt
> Use this file to discover all available pages before exploring further.

# Overview

export const InlineImageWithText = ({src, href, children, width = 80, caption}) => {
  return <span className="inline-flex items-center gap-3 align-middle">
            <a href={href} className="inline-block border-b-0">
                <Frame caption={caption}>
                    <img src={src} alt="" className="object-contain align-middle " width={width} style={{
    minWidth: width
  }} />
                </Frame>
            </a>
            <span className="align-middle">{children}</span>
        </span>;
};

<div style={{ width: "100%", display:"flex", flexDirection:"row", alignItems:"center", gap:"20px"}}>
  <div style={{ width: "100px", minWidth: "100px" }}>
    <Frame>
      <img src="https://mintcdn.com/densify-sync-changelog-2/0M79aWH4doODyT20/images/docs-kubex/Content/Kubex/03000092.png?fit=max&auto=format&n=0M79aWH4doODyT20&q=85&s=c5181a44effd0fac4ac977923545b933" width="55" height="58" data-path="images/docs-kubex/Content/Kubex/03000092.png" />
    </Frame>
  </div>

  <p>Kubex analyzes your node groups providing visibility to the health of your node groups, including risks that are impacting the stability of the containers they are hosting. Use the <a href="/docs-kubex/Content/Kubex/Using_the_Node_Tree_Viewer">node tree viewer</a> to navigate and explore node groups.</p>
</div>

<Frame caption="Figure: Node Group Analysis">
  <img src="https://mintcdn.com/densify-sync-changelog-2/0M79aWH4doODyT20/images/docs-kubex/Content/Kubex/03000125_680x272.png?fit=max&auto=format&n=0M79aWH4doODyT20&q=85&s=7bda25ba3444ef1713d32912b1333ba1" alt="" width="680" height="272" data-path="images/docs-kubex/Content/Kubex/03000125_680x272.png" />
</Frame>

Additionally, node group capacity metrics highlight possible capacity shortfall, or where you have excess capacity, along with the actions to resolve these issues.
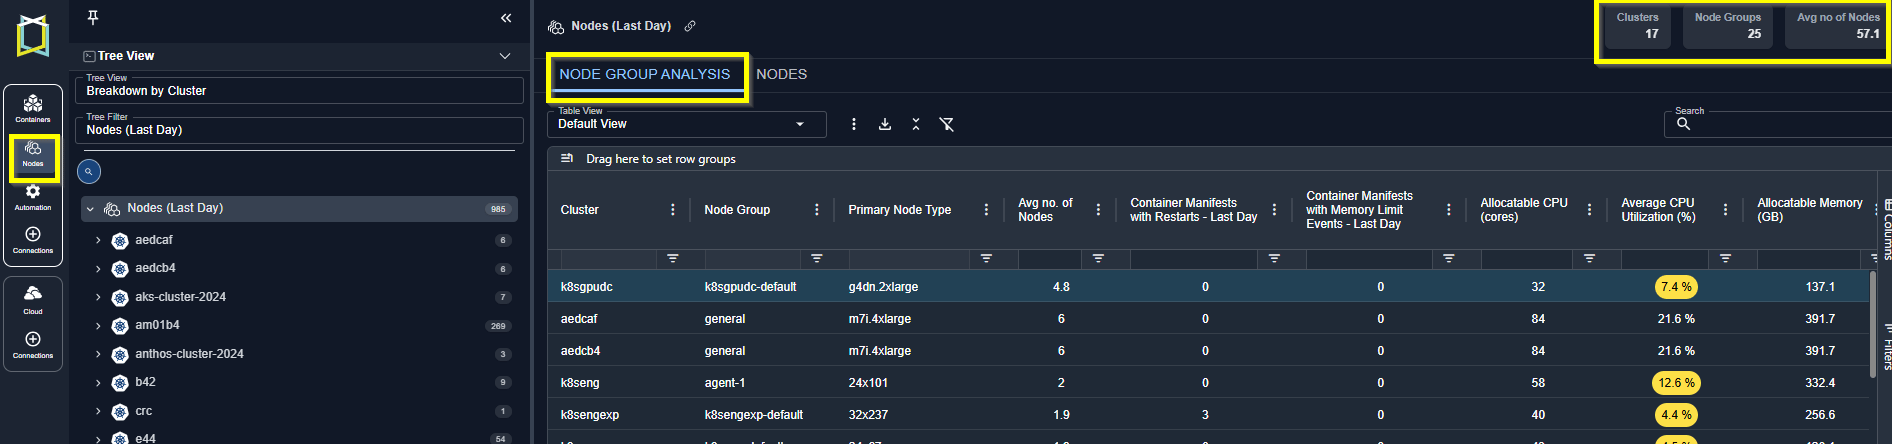
### Summary Bar

Summary totals are displayed in the upper right corner of the page. These totals are for the node groups displayed on the current page and not all analyzed containers.

These totals also reflect any cluster and/or node group filter options you have defined on this page.

<Frame caption="Figure: Node Group Analysis">
  <img src="https://mintcdn.com/densify-sync-changelog-2/_QFurq0mJrs1QK9R/images/docs-kubex/Content/Kubex/03000206_648x190.png?fit=max&auto=format&n=_QFurq0mJrs1QK9R&q=85&s=c374368a8c36b5a3d7d3a9fb804523d7" alt="" width="1892" height="444" data-path="images/docs-kubex/Content/Kubex/03000206_648x190.png" />
</Frame>

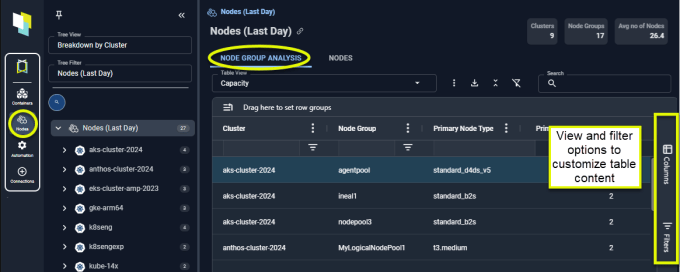
### Viewing Your Node Group Data

The [Node Group Analysis](/docs-kubex/Content/Kubex/Node_Group_Analysis_Table) page displays key metrics that help you identify nodes that are CPU or memory saturated. A number of preconfigured views are provided that focus on the following aspects of your infrastructure:

<ul>
  <li>Health--The columns have been selected to show you the overall health of your nodes. The performance of your node groups affects the containers that are being hosted and can be wasteful if resources are under-allocated.</li>
  <li>Capacity--The columns have been selected to show you how effectively your node group resources are being used.</li>
  <li>Waste--The columns have been selected to quickly show wasted resources and possible money-saving recommendations.</li>
</ul>

<Note>
  <strong>Note:</strong> Data for both node groups and individual nodes is derived from the past 7 days of collected data.
</Note>

See [Node Group Analysis Tab](/docs-kubex/Content/Kubex/Node_Group_Analysis_Table) for details.

### Viewing Your Node Data

You can view the utilization details of the individual nodes on the [Nodes](/docs-kubex/Content/Kubex/Nodes_Tab) tab.
